Beyond Case Numbers: Navigating the New World of COVID-19 and Respiratory Virus Surveillance
During the early years of the COVID-19 pandemic, it seemed every country had a dashboard. Daily case numbers, hospitalisations, testing rates and deaths were updated around the clock, providing an unprecedented view of a rapidly evolving public health emergency.
Today, the situation is very different.
Many governments have scaled back routine testing and public reporting. Daily case counts have largely disappeared, and with fewer people seeking PCR testing, confirmed case numbers no longer provide a reliable estimate of how much virus is circulating in the community.
The good news is that epidemiological surveillance hasn't disappeared—it has evolved.
Rather than relying on a single metric, public health experts increasingly combine multiple independent data sources to understand what is happening in the community. This approach provides a richer and often more accurate picture of respiratory virus activity than confirmed case numbers ever could.
No Single Number Tells the Whole Story
Each surveillance system provides a different window into community transmission.
Some detect infections before people develop symptoms.
Others measure healthcare demand.
Some estimate community transmission without requiring anyone to be tested at all.
Understanding respiratory disease activity today means looking at these data sources together rather than in isolation.
Wastewater Surveillance
Perhaps the biggest advance since 2020 has been wastewater surveillance.
People infected with respiratory viruses shed viral material into wastewater through everyday activities. By analysing wastewater collected from treatment plants, scientists can estimate how much virus is circulating within an entire community.
Wastewater surveillance offers several important advantages:
It doesn't rely on people seeking testing.
It captures symptomatic and asymptomatic infections.
It often provides an early warning before increases in hospitalisations.
It can monitor multiple respiratory pathogens simultaneously.
Many countries now routinely monitor SARS-CoV-2, influenza and RSV through wastewater, and genomic sequencing can also identify emerging variants. Australia's National Wastewater Surveillance Program is an excellent example of this evolving approach.
Test Positivity
PCR test positivity remains valuable where systematic testing continues.
Rather than counting the total number of cases, positivity measures the proportion of tests that are positive.
A rising positivity rate generally indicates increasing community transmission.
However, because relatively few people now undergo PCR testing in many jurisdictions, positivity must be interpreted alongside other surveillance measures.
Hospitalisations
Hospital admissions remain one of the most robust indicators of severe disease.
Unlike reported case numbers, hospitalisations are less affected by changes in testing behaviour.
Their main limitation is timing—they generally increase days or weeks after infections have already begun rising in the community.
Emergency Department Presentations
Many health departments now monitor emergency department presentations for influenza-like illness and acute respiratory infections.
These data can provide an earlier indication of increasing respiratory illness before hospital admissions begin to climb.
Sentinel Surveillance
Many countries operate sentinel surveillance programs through participating general practices and laboratories.
Patients presenting with respiratory symptoms are systematically tested, allowing public health authorities to estimate which respiratory viruses are circulating and how their activity changes over time.
Genomic Surveillance
Sequencing continues to play a critical role in identifying emerging variants and tracking how viruses evolve.
Increasingly, genomic surveillance is being performed on both clinical samples and wastewater, providing an important early warning system for public health agencies.
Community Symptom Tracking
Programs such as FluTracking ask volunteers to report respiratory symptoms each week, regardless of whether they seek medical care.
These community-based systems provide another valuable layer of surveillance and help identify trends that may not be apparent from healthcare data alone.
Where Are the Gaps?
Despite these remarkable advances, important challenges remain.
There is still no single dashboard that integrates:
Wastewater surveillance
Test positivity
Hospitalisations
Emergency department presentations
Laboratory surveillance
Genomic sequencing
Community symptom reporting
into one easy-to-understand picture.
Many dashboards also remain fragmented between different jurisdictions, making comparisons difficult.
Perhaps the biggest gap is that there is still no routine monitoring of airborne virus concentrations within the indoor environments where transmission actually occurs. While research in environmental biosurveillance is advancing rapidly, continuous real-time pathogen monitoring inside buildings remains an important goal for the future.
Independent Researchers Are Filling Some of the Gaps
As official reporting has become less comprehensive, a number of independent researchers have stepped in to synthesise the available data.
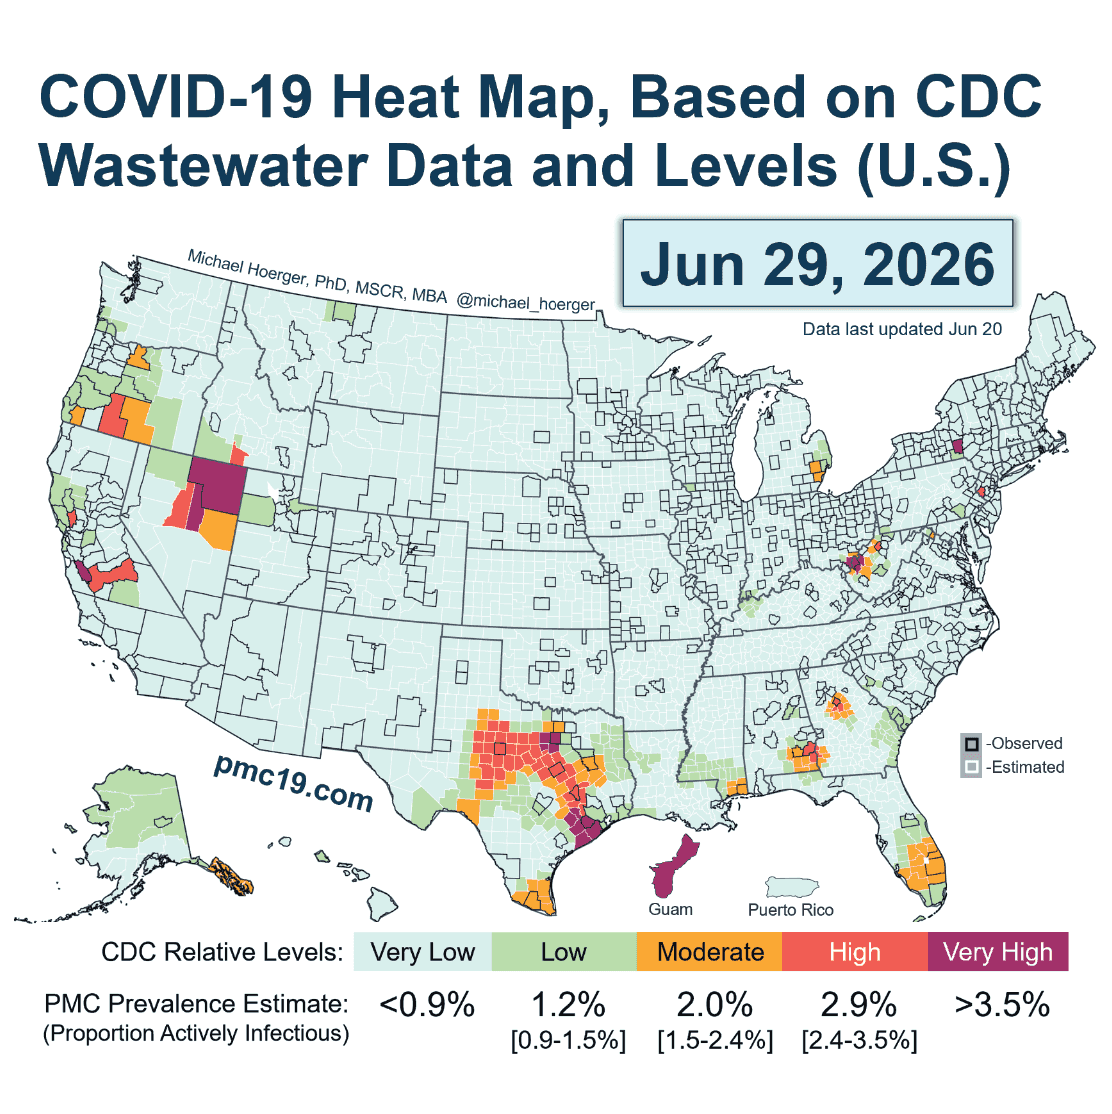
One of the most widely followed examples is Dr Michael Hoerger and the Pandemic Mitigation Collaborative (PMC).
Rather than relying on reported case numbers alone, the PMC combines wastewater surveillance, hospital data and epidemiological modelling to estimate the true level of COVID-19 transmission across the United States. Their weekly reports translate complex datasets into practical estimates such as daily infections, the proportion of people currently infectious and projected transmission trends. The methodology and reports are publicly available and are updated regularly.
For many people, the PMC dashboard has become one of the most useful independent resources for understanding current COVID-19 activity after routine case reporting declined.
You can explore the latest reports here:
Where Should You Look?
If you'd like to understand respiratory virus activity in your own community, these are among the most useful resources:
Australian Centre for Disease Control – National Wastewater Surveillance Program
Australian Respiratory Surveillance Reports
Your state or territory health department's respiratory surveillance reports
World Health Organization respiratory surveillance dashboards
FluTracking
Pandemic Mitigation Collaborative (United States): https://www.pmc19.com/data
No single source is perfect, but together they provide a much more complete understanding of respiratory virus activity than confirmed case numbers alone.
Looking Ahead
The future of respiratory surveillance is unlikely to rely on one new technology. Instead, it will involve integrating many complementary data streams into a single, easy-to-understand picture.
Imagine a platform that combines:
Wastewater surveillance
Respiratory virus activity
Genomic sequencing
Hospital demand
Environmental monitoring
Indoor air quality
Building ventilation performance
Community symptom reporting
Such a system could provide earlier warnings, better situational awareness and more informed public health decision-making.
At ICAAN (the Indoor Clean Air Adoption Network), we believe this represents the next evolution of public health intelligence.
Clean indoor air is only part of the picture.
Understanding what is circulating within our communities, and combining that knowledge with information about the environments where transmission occurs, has the potential to transform how we respond to respiratory disease.
The dashboards of the future won't simply report what happened yesterday.
They will help us make better decisions today.